
FieldMap v3.2
User Manual
Introduction
TO DO basic description
FieldMap requires a Java runtime system compatible with the Personal Java specification or with the Java 1.1.8 release. For use with a GPS receiver attached to a serial port it also requires a suitable implementation of the javax.comm communications extension.
FieldMap is designed for use on PDAs, desktop and laptop computers It has been tested on iPAQ 3660 and 3970 models running PocketPC and PocketPC 2002, and on the Zaurus SL-5500, all using the Jeode Java runtime system. The program has also been tested with Sun Java 1.1.8, and all subsequent versions up to and including J2SE 1.4.1 on Windows 98, NT4, 2000, XP, and RedHat Linux 7.3 and 9.
FieldMap uses a web server and Java servlet engine to generate FieldNote pages. This release includes a binary distribution of LiteWebServer v2.2.2 from Gefion software. The following statement is included in accordance with the terms of the LiteWebServer licence:
Later versions of FieldMap may be updated to use a more recent version of LiteWebServer or, indeed, an alternative server.
Downloading FieldMap
The FieldMap distribution is available as a zip file for Windows (FieldMap-3_2_1.zip) and a gzipped tar archive for Linux users (FieldMap-3_2_1.tgz). Note that the separate formats are provided simply as a convenience for downloading and unpacking. Both have identical contents and include the platform-specific components for all platforms.
This maual is also available separately in .zip and .tgz formats
Installation
The following instructions assume that both FieldMap and LWS are to be installed. To install FieldMap for use with a different web server and servlet engine, extract only the MobiComp directory from the distribution archive and ignore all references to LWS in these instructions and consult the section on Startup and Configuration Files.
- If an earlier verion of FieldMap is installed on the machine, locate
the MobiComp directory.
- If it has been used to create FieldNotes, make a back up copy of the existing FieldNote directory.
- If you have created any maps, also backup the FieldMap directory.
- Delete MobiComp and everything below it.
- If any web pages or other material have been added to the LiteWebServer installation, these should also be backed-up.
- Delete any earlier version of LiteWebServer.
Windows PC
- Choose a suitable location to install FieldMap and LWS. The simplest method is to install in the root directory of the C: drive as this requires the minimum of changes to configuration scripts. In the following instructions, the chosen directory is shown as <installdir>.
- cd into the installation directory and unzip the archive file. This will unpack two directory trees rooted at MobiComp and lws.
- If MobiComp and lws have been installed anywhere other than
C:\, or if LWS is not going to be used, or you are using Java 1.1,
edit <installdir>\MobiComp\bin\runFieldMap.bat following the
instructions in the file and paying attention to the variables:
- MOBICOMP the pathname of the MobiComp directory.
- LWS the pathname of the lws directory.
- LWSCONF runtime directive pointing to the lws/config directory.
- LWSJARS classpath entries for lws/servlets and lws/lib/Webserver.jar.
- COMMJARS classpath entries for javax.com jars (if using Java 1.1).
- Decide which web browser to use. Recent versions of IE are usually at c:\Program Files\Internet Explorer\iexplore.exe. If IE is located elsewhere, or you wish to use a different browser, edit <installdir>\MobiComp\FieldNoter.properties setting the webBrowser property to the full pathname of the required browser. Note, quotes are needed around the path if it contains spaces, and backslash separators must be shown as \\. If in doubt, see the distributed version which is already setup for the normal location of IE.
- If LWS is installed anywhere other than C:\, edit
<installdir>\lws\config\server.properties,
and update the following Windows entries. Ensure that everything else
is commented-out (lines should begin with #).
server.logfile=/lws/log.txt
server.docroot=/lws/html/default
server.workdir=/lws/work
Adjust these paths if LWS was installed elsewhere, again noting the use of UNIX-style separators. - FieldMap should now be ready to run.
PocketPC
- Unpack the zip or tar archive in a suitable location on the desktop PC.
- Connect the PocketPC to the desktop using Active Sync and open an Explorer window on the desktop to view the contents of the PocketPC.
- Copy the MobiComp directory tree to \MobiComp on the PocketPC.
- Copy the lws directory tree to \lws on the PocketPC.
- Copy one or both of the shortcut files MobiComp\bin\FieldMapM.lnk and MobiComp\bin\FieldMapM debug.lnk to \Windows\Start Menu or \Windows\Start Menu\Programs on the PocketPC.
- FieldMap should now be ready to run.
Linux (PC)
- Choose a suitable location to install FieldMap and LWS. The simplest method is to install in /usr/local as this requires the minimum of changes to configuration scripts. In the following instructions, the chosen directory is shown as <installdir>.
- cd into the installation directory and unpack the archive
using the command:
tar zxvf FieldMap-3_2_x.tgz
This will unpack two directory trees rooted at MobiComp and lws. - If MobiComp and lws have been installed anywhere other than
/usr/local, or if LWS is not going to be used, or you are using Java 1.1,
edit <installdir>/MobiComp/bin/runFieldMap.sh following the
instructions in the file and paying attention to the variables:
- MOBICOMP the pathname of the MobiComp directory.
- LWS the pathname of the lws directory.
- LWSCONF runtime directive pointing to the lws/config directory.
- LWSJARS classpath entries for lws/servlets and lws/lib/Webserver.jar.
- COMMJARS classpath entries for javax.com jars (if using Java 1.1).
- Edit <installdir>/MobiComp/FieldNoter.properties setting the
webBrowser property to the full pathname of the required
browser, e.g.
webBrowser=/usr/bin/mozilla - If using LWS, edit <installdir>/lws/config/server.properties,
un-comment the following Linux entries and ensure that everything else
is commented-out
server.logfile=/usr/local/lws/log.txt
server.docroot=/usr/local/lws/html/default
server.workdir=/usr/local/lws/work
Adjust these paths if LWS was installed elsewhere. - FieldMap should now be ready to run.
Linux (Zaurus)
- TO DO
- FieldMap should now be ready to run.
Running FieldMap
Windows PC
- Execute the command \MobiComp\bin\runFieldMap.bat or, if installed elsewhere, <installdir>\MobiComp\bin\runFieldMap.bat.
- Skip to All Platforms
PocketPC
- If the FieldMap.lnk file was installed in the Start menu, tap Start, then tap on the FieldMap icon in the Start menu. Otherwise, tap Start, then Programs then tap on the FieldMap icon on the Programs page.
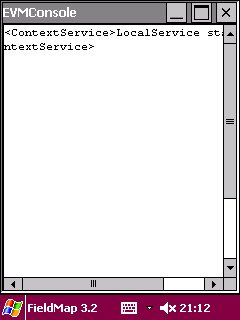
- The EVMConsole window display appears while the first part of the program is loading. This window is normally empty but informational and error messages may be shown here.
- Skip to All Platforms
Linux (PC)
- Execute the command /usr/local/MobiComp/bin/runFieldMap.sh or, if installed elsewhere, <installdir>/MobiComp/bin/runFieldMap.sh
- Skip to All Platforms
Linux (Zaurus)
- Open the Jeode tab and tap on the FieldMap icon.
- Skip to All Platforms
All Platorms
|
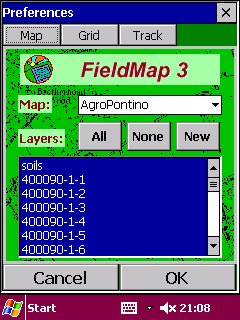
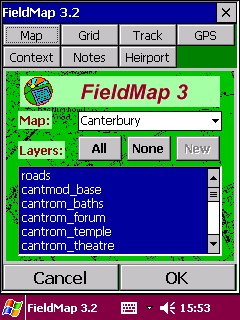
After an delay, the initial Preferences display appears. The drop-down Map: list shows all available map sets. On changing the selected map, the list of layers below is refreshed to show the layers available for the chosen map. Layers may be selected/deselected as required. The All and None buttons provide quick ways to select or deselect all layers. The New layer button is disabled in this version. At the top of the display, the three buttons Map Grid and Track, give access to various pages of preference settings. These are described below After choosing a map and selecting the required layers, press the OK button to complete the initial setup and run the mapping program. |
|
||
|
On PocketPC machines using the Jeode runtime system, the EVMConsole display reappears while the rest of the program is loaded. A message will appear indicating that a local Context Service has been started. |
|
||
|
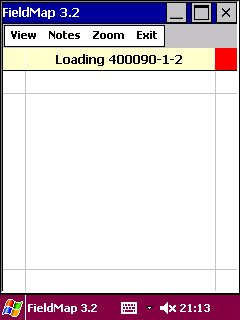
Next, the Map View appears, and map loading commences. As each map is loaded, its name appears in the message area near the top of the screen. In the picture, the message Loading 400090-1-2 indicates that the named raster layer (part of a scanned topographic map) is being loaded. Note that the first raster layer may take some time to load, but subsequent layers are loaded much more rapidly. |
|
||
|
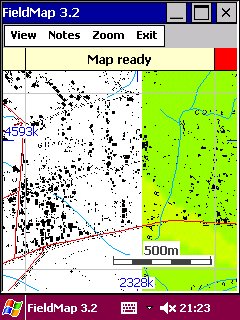
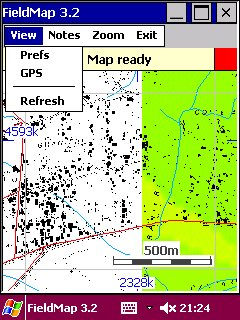
When map loading is complete, the message Map ready appears in the message area. The example shows several tiles of a scanned topographic map, part of a soil map (a colour raster layer exported from a GIS), and two vector layers representing roads (red) and water (blue). |
|
||
Map view |
|||
|
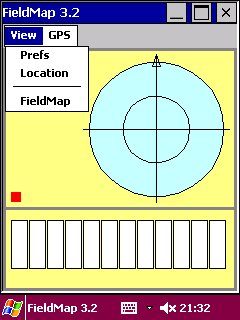
TO DO brief description First, a quick tour of the menus: The View menu provides options to
|
|
||
|
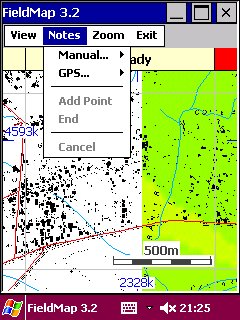
The Notes menu provides options to
For further details, see Creating FieldNotes. |
|
||
|
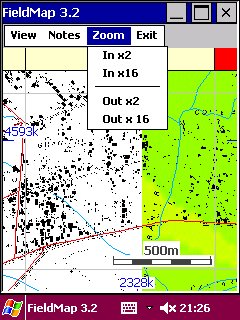
The Zoom menu provides options to
|
|
||
|
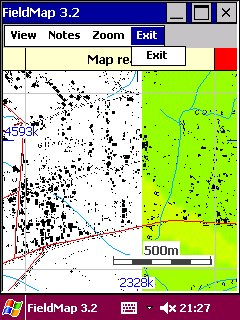
The Exit menu provides a single option to confirm termination. Tap anywhere else to cancel. |
|
||
Active areas in the Map viewSeveral areas of the map view respond to pen taps or mouse clicks. Tapping or clicking on
GPS view |
|||
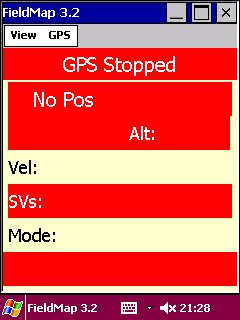
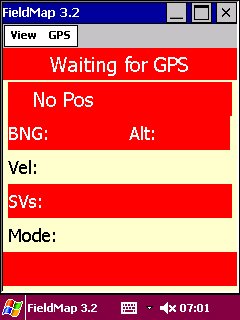
When first opened, the GPS data view shows the message GPS Stopped with all remaining fields empty. Note that certain fields (the coordinates at the top, number of satellites (SVs:) and the time field at the bottom) appear with a red background. This indicates that the data in these fields is missing or unreliable. |
|
||
|
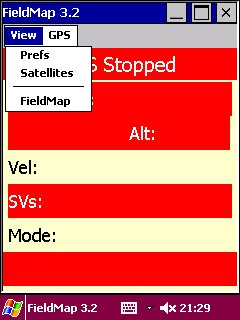
The View menu provides options to
|
|
||
|
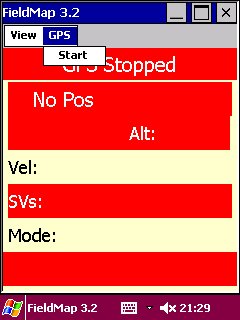
The GPS menu provides a single option to start and stop input from a GPS receiver. See also, Using a GPS receiver. When the receiver connection is stopped the menu choice is Start as shown here. Once the connection is running the menu changes to Stop and selecting this item again will close the connection.
|
|
||
GPS Satellite view |
|||
|
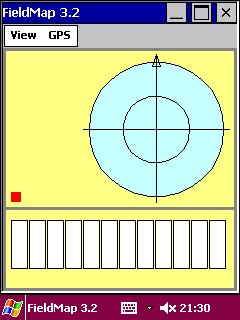
When first started, the Satellite view is also empty. It consists of two areas. At the top is the sky map, used to show positions of GPS satellites. At the bottom is a row of vertical bars, used to show the signal strengths received from satellites. see also Satellite view when running. |
|
||
|
The Satellite View menu provides options to
|
|
||
Preferences viewOnce maps have been loaded, the Preferences view shows several more buttons at the top. Each of these gives access to an individual preferences page: Also visible on each preference page are the buttons:
|
|||
Map Preferences
|
|
||
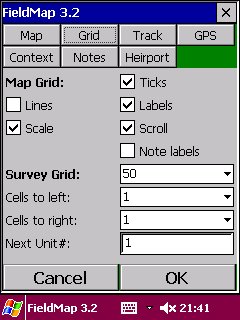
Grid PreferencesThe first group of settings affect how the grid, coordinate lables, scale and scroll areas are shown on the MapView.
|
|
||
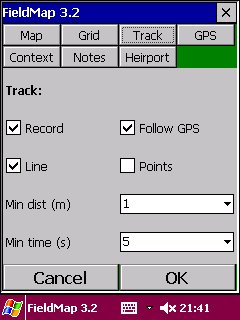
Track PreferencesThese settings affect display and recording of the users track and whether the map scrolls automatically with GPS location.
|
|
||
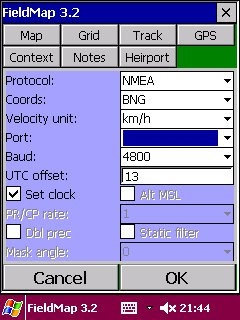
GPS PreferencesThese settings control communication with the GPS receiver and the behavious of the GPS view.
|
|
||
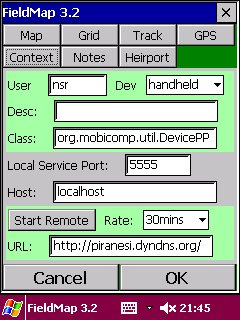
Context PreferencesThese settings control some aspects of the context-aware components of FieldMap and its interaction with context services. With the exception of the first setting these may be ignored, but should not be changed, unless FieldMap is being used as part of a context aware wireless infrastructure.
|
|
||
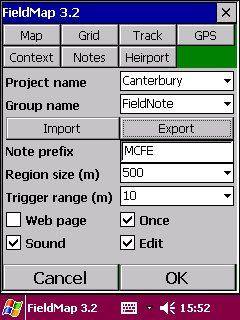
Notes PreferencesGeneral FieldNote settings:
|
|
||
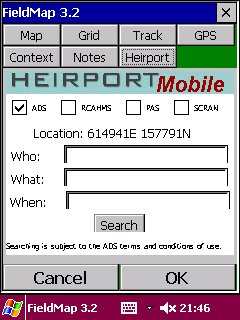
Heirport Query PreferencesThe Heirport view is part of ongoing experimental work with the Archaeology Data Service to provide mobile location-aware access to ADS and other databases. The view seen in this release is not fully functional and will not be decribed further. |
|
||
Using a GPS receiver |
|||
|
After selecting Start from the GPS menu, the message at the top of the screen changes to Waiting for GPS. During this phase, the GPS tracker component attempts to open a connection to the GPS receiver |
|
||
|
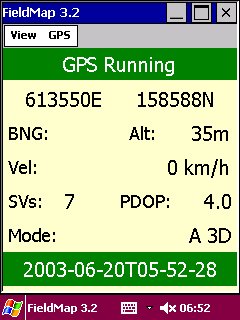
The message GPS Running appears as soon as a connection to the receiver is established. Soon after, the background of the date and time field at the bottom of the screen should change from red to green. This indicates that the time shown is derived from the GPS receiver. A red background indicates a date and time from the computer's internal clock. The GPS time is always UTC, taking no account of local time zones. The delay between starting the GPS tracker and the appearance of reliable location and velocity data as shown here can be anything from a few seconds to a couple of minutes depending on the acquisition time of the receiver. The picture gives an example of a good position fix. The first line below the GPS Running message shows the east and north coordinates. The coordinate system in use, in this case the British National Grid, and altitude appear on the second line, and the third line shows the current velocity and heading (in degrees). No heading is shown in this case as the velocity is zero. On the fourth and fifth lines are details of the satellite constellation and the quality of the location fix. In this example, data is being collected from 7 satellites, the Position Dilution of Precision (PDOP) is 4.0, and the receiver is operating in automatic 3D mode. |
|
||
|
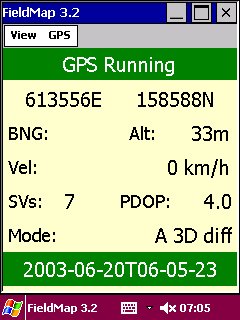
In the second picture of the running GPS view, the mode has changed to indicate that a differential correction signal has become available. In this case it is European Geostationary Navigation Overlay Service (EGNOS) test signal from one of the Inmarsat satellites. This service is due to become fully operational in 2004. |
|
||
|
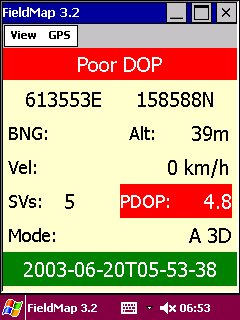
The quality of GPS Positioning is dependent on many factors, and may not always be as good as in the previous two illustrations. A 3D fix requires at least four satellites to be visible at the receiver. Ideally, the available satellites should be spread evenly around the sky in order to provide a geometrically 'good' constellation and minimise errors in calculating the location. The PDOP figure is a measure of the quality of the constellation. The ideal figure of 1.0 is never reached, but anything below 4 is generally considered to be reasonable. Here, the PDOP has risen above 4, so the program draws attention to the possible reduction in fix quality by showing Poor DOP against a red background in the message area and also turning the background of the PDOP figure red. |
|
||
|
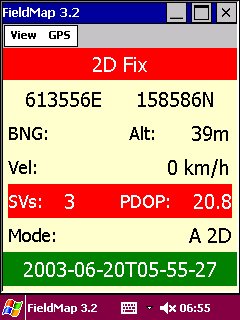
With only three satellites, the receiver can only provide a 2D fix. Here, the message area shows 2D Fix against a red background, and both the number of satellites and PDOP have a red background to draw attention to their poor figures. An altitude figure is still shown but cannot be relied upon as most receivers continue to show the altitude unchanged from the last 3D fix |
|
||
|
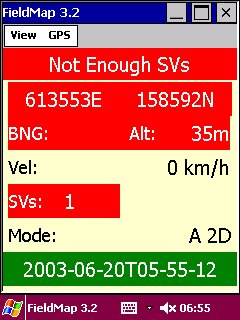
Here the situation is even worse! The number of satellites has dropped to one and the receiver can no longer provide position and velocity data. The message Not Enough SVs, the coordinates, altitude and number of satellites are now all shown with a red background. Note, however, that it is still possible to maintain an accurate time signal with a single satellite. |
|
||
|
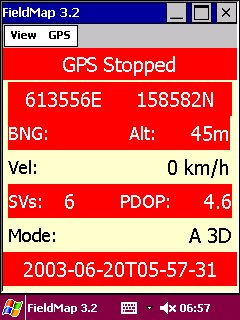
After selecting Stop from the GPS menu, the message area again shows GPS Stopped, but now all of the data remains on the screen. Red backgrounds indicate that this is all out-of-date information. This screen may also appear during normal running if the connection to the receiver fails. Typically this happens if the computer or receiver are switched off. Under these conditions, the program usually detects the failure after about 30 seconds. It then closes the connection, waits for 5-10 seconds, then restarts it. |
|
||
|
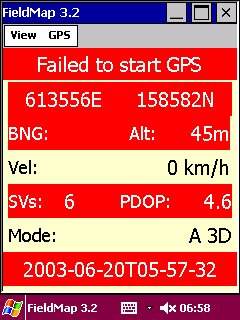
Finally in this sequence covering the GPS data view, this picture shows what happens if an error occurs when attempting to start the GPS connection. Instead of the usual Waiting for GPS message, the message area shows Failed to start GPS. There are several possible reasons why this may happen. Sometimes, the program may simply fail to synchronize with the incoming data, in which case, a second attempt to start is invariably successful. Other common causes include a physical failure such as a cable between computer and receiver, or the receiver has been switched off, or the receiver batteries have expired. |
|
||
Satellite view when running |
|||
|
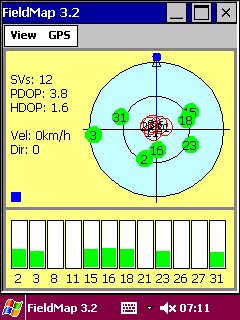
When the GPS is running, the satellite view shows information about received signals. It is divided into two panels. The upper panel has summary information on the left including the total number of satellites above the horizon, PDOP, HDOP, velocity and direction of travel. HDOP is the Horizontal Dilution of Precision. It is the 2D equivalent to the 3D PDOP and its lower value indicates the higher precision of horizontal location in comparison with the altitude figure calculated by a GPS receiver. . On the right of the upper panel is a "sky map" showing the location of visible satellites. North is at the top, the outer ring represents the horizon and the inner ring an elevation of 45 degrees. The centre of the circle is the point vertically overhead. The satellites from which a good signal is being received and which are being used in the position calculations are shown in solid green. Solid red indicates those from which a signal is being received, but which are not yet being used, whilst open red circles represent satellites from which a signal has not yet been received. . The small blue square in the lower left of the upper panel is an activity indicator. This toggles on and off with each message from an active receiver, and turns red if the connection is lost or no position is available. . The lower panel shows relative signal strengths for each of the available satellites. Solid green and red bars are used to indicate satellites in the same way as on the sky map. |
|
||
|
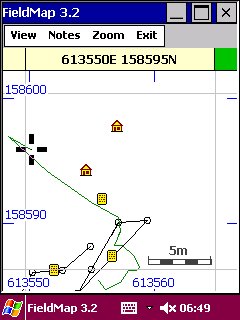
When the GPS module is running, the map view shows the current coordinates in the message area, updated with each new fix from the receiver. The activity indicator to the right of the message area now shows green, turning on and off with each new fix. If the GPS signal fails or the connection is lost, the activity indicator reverts to red. . Within the map area, the cursor moves to track the location and, if enabled in the Track Preferences, the recent track is shown as a green line |
|
||
Creating FieldNotes |
|||
|
FieldNotes may be attached to points, lines or polygons. Point or vertex coordinates may be entered manually, or using the GPS location. Additionally, survey grid units may be recorded using the GPS location, see Recording Survey Grid Units. |
|
||
|
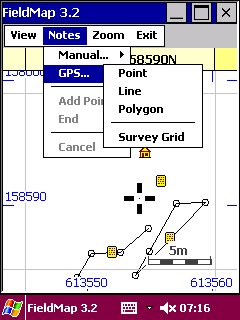
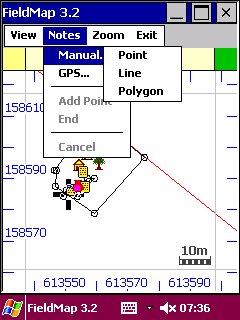
The procedures for recording a note are similar whether the GPS or manual input is used. The note geometry is always recorded before completing the note entry form. First, select Manual or GPS from the Notes menu, then choose Point, Line or Polygon as required. |
|
||
|
Manual input:
GPS input:
In either case, if point was selected, the FieldNote entry form will appear in a web browser window, see FieldNotes Entry Form. If Line or Polygon was selected, continue with the next picture below. |
|
||
|
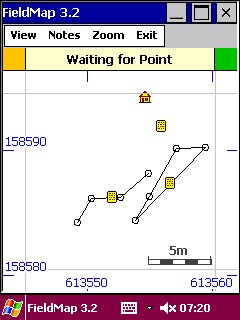
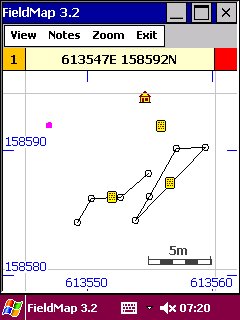
When recording a line or polygon, the geometry input indicator turns orange whenever the system is waiting for a point. The indicator also shows the count of points captured so far. Manual input:
GPS input:
|
|
||
|
Continue adding vertices in the same way until the line or polygon is complete. Note that there is no need to try to match the final vertex of a polygon with its first, as the polygon will be closed automativally. |
|
||
|
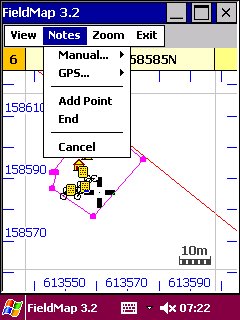
After capturing the final vertex of a line or polygon, select End from the Notes menu. For polygons, an final line from the last to the first points is added automatically. Geometry input may be abandoned at any time by selecting Cancel from the Notes menu. |
|
||
|
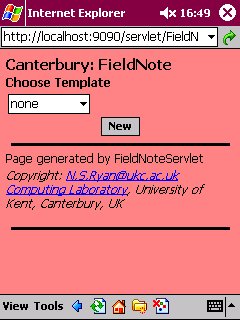
On completion of geometry capture, FieldMap invokes the web browser and sends a request to the web server to display a new FieldNote Entry Form. The server responds with a template request form. Select the required template name, or none from the drop-down list and press the New button to request the note entry form. For more information on templates, see Creating new FieldNote templates. |
|
||
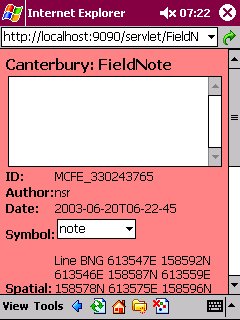
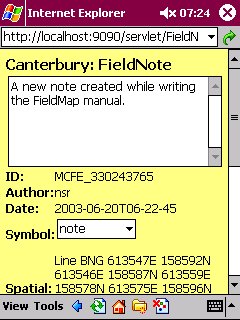
FieldNotes Entry FormWhen the note entry form appears, the FieldNote already includes some information, the project and note group names, a unique FieldNote ID, the name of the author, the date and time or creation, and the recorded geometry. Note that the form has a reddish colour. This indicates a new note that has not yet been saved. The picture shows a simple note created without a template. Such notes contain only two editable fields, a text area and a drop-down list of map symbols. |
|
||
|
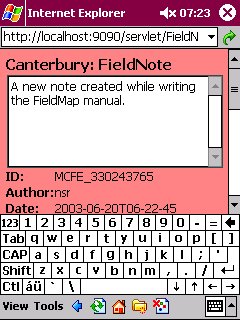
Text can now be typed into the note. If a template was specified, the template fields may also be completed.. |
|
||
|
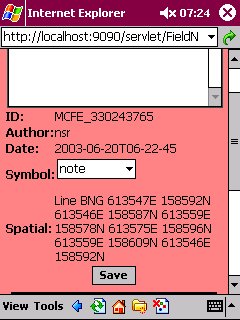
When entry is complete, press the Save button at the end of the note. On a small screen, it is usually necessary to scroll down to find this button. |
|
||
|
When the FIeldNote has been saved, the web server returns a copy to the browser with a yellow background. This indicates a note that has been saved previously. |
|
||
|
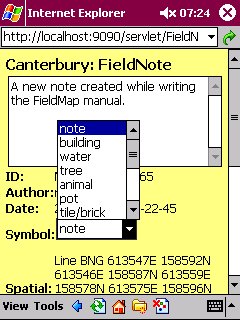
The saved note may be edited. In this example, the symbol is being changed. |
|
||
|
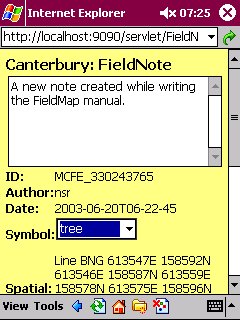
After changing the note, always remember to press the save button. However, this is not necessary if the note is not changed. |
|
||
|
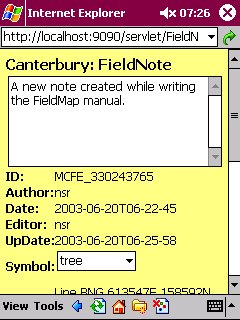
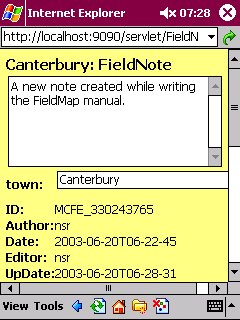
After saving changes, the revised note is returned. Now, however, it includes additional fields to indicate the name of the last editor and the date and time it was last changed. |
|
||
|
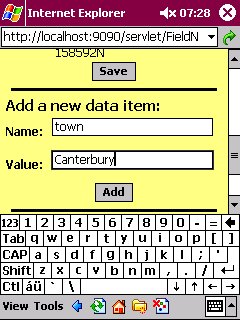
It is also possible to add arbitrary fields to a note. To do this, scroll down beyond the Save button to the section Add a new data item. Then enter the field name and value, and press the Add button. |
|
||
|
When a field has been added, it appears as an editable text field in the entry form. |
|
||
|
When note entry or editing is complete, close the web browser and return to FieldMap. The new note should appear as a symbol on the map. |
|
||
Recording Survey Grid Units |
|||
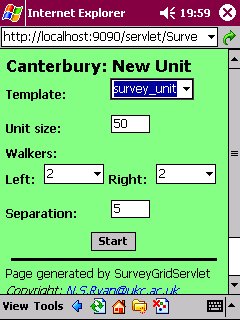
New Unit FormTo create a new SurveyGrid note, select GPS.../Survey Grid from the Notes menu. This sends a request to start a new grid unit to the web server. The response, in a web browser window, is the New Unit form shown here. Select the required template and, if necessary, edit the following fields:
When ready to start walking the unit, press the Start button. This requests a Survey Unit Form from the web server, logs the starting position, and starts a Proximity Tracker. |
|
||
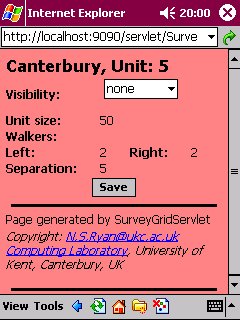
Survey Unit FormThe Survey Unit Form includes editable fields from the template, and non-editable fields for the values entered in the New Unit Form. These may be completed at any time before pressing the Save button. As soon as the form appears, the system is ready to record the unit. However, the Save button should not be pressed until the end of the unit is reached, because it also records the finishing position. The recommended procedure is to switch back to the map view so that progress is visible while walking, and to await firing of the Proximity Tracker. |
|
||
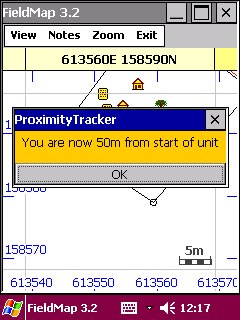
Proximity TrackerThe proximity tracker sounds an alarm and pops up the window shown here when the GPS position detects that the user has covered the unit size distance from the start point. Stop immediately, press the OK button on the pop-up window, and switch back to the Survey Unit Form to complete the data entry and then press the Save button to store the new unit note. The new note will be numbered automatically, and will include the measured distance covered and the bearing as part of the note data. |
|
||
|
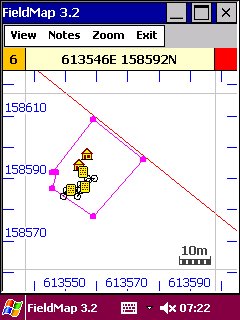
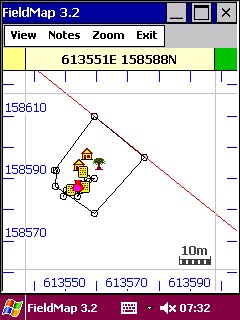
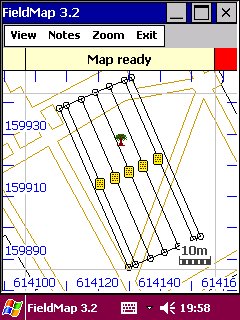
When the new unit has been recorded, it will appear on the map as a graphic representing the area covered by the walkers. The outermost parallel lines are at half of the walker separation beyond the outer walkers, and represent the limits of the area covered by them. |
|
||
Creating new FieldNote templates
FieldNote template files contain HTML fragments representing input elements to be added to a note. They are stored in the <installdir>/MobiComp/FieldNote/templates directory. A simple example called survey_unit is provided in this distribution.
Template files should contain only valid HTML markup suitable for placing within <form>...</form> tags. The markup in a template file will be inserted on the page immediately below any header and above any footer created automatically by the system.
Notes:
- Only template files should be placed in the templates directory. DO NOT add any other type of file to this directory.
- Use minimal spacing, e.g. within table elements, to minimise wasted space on a small display. Consider not using tables if the forms are to be used in PocketIE, as this browser introduces extra space around text input fields.
- Names of input elements are normally free (but see below), and should be unique within a template. These names will be used as the tag or variable name in the data recorded using the form.
- The following element names should be treated as reserved words, and not
used in any template:
- All FieldNotes:
- id a note identifier
- prefix initial string part of identifier
- cmd a command sent to a serlet
- project name of the current project
- group name of the note group within a project
- user user name
- template template name
- name name of field added to a note when editing
- value value of field added to a note when editing
- text the general-purpose text field in all notes
- Survey unit notes:
- unit survey unit number
- walkersLeft no of walkers to left of recorder
- walkersRight no of walkers to right of recorder
- sep separation distance between walkers
- All FieldNotes:
- Production template files will be processed much more quickly if they do not include comments!
Creating new projects
To create a new project, create the FieldMap project directory:
Windows: <installdir>\MobiComp\FieldMap\<project_name>
Linux: <installdir>/MobiComp/FieldMap/<project_name>
and the FieldNote project directory:
Windows: <installdir>\MobiComp\FieldMap\<project_name>
Linux: <installdir>/MobiComp/FieldMap/<project_name>
Then add map layers, see Creating new map layers,
and note groups, see Creating new note groups,
as required.
Creating new map layers
Vector map layers
Vector map layers are imported using the MapLoader program which is not yet ready for general release. Input may be in GRASS ASCII vector or ESRI Shape file formats. MapLoader generates metadata entries in the map catalogue file. There is, at present, no other way of generating vector layers
Raster map layers
Raster maps are imported as gif images. Transparent images may be overlayed. At present, the only way of importing raster layers is to place the file in the project map directory <installdir>\MobiComp\FieldMap\<project_name> under Windows or <installdir>/MobiComp/FieldMap/<project_name> under Linux, and add an appropriate metadata line in the map catalogue file.
Note map layers
Note layers are 'virtual' layers. No mapping data is stored in the project map directory, but a metadata entry must be included in the map catalogue file. The name of the layer must correspond to the equivalent note group in the project notes directory.
The map catalogue file
Metadata for all map layers is stored in the map layer catalogue in <installdir>\MobiComp\FieldMap\mcfeMapStore.map under Windows or <installdir>/MobiComp/FieldMap/mcfeMapStore.map under Linux. The following shows three example entries in this file, one each for the three types of layers, vector, raster and note.
Canterbury roads       V BNG - 61184277 15611355 61638754 16119658 16711680 0    0 0 Roads from kvr1000
Canterbury kvr_612_157 R BNG - 61200000 15700000 61299999 15799999 1000     1000 0 0 kvr1000 tile
Canterbury FieldNote   N BNG - 61352300 15700000 61400000 16016135 0        0    0 0 FieldNote locations
Map layer entries may appear in any order with layers from different projects inter-mixed. However, for any project, the order of entries in this file dictates the loading order within each layer type. Raster layers are loaded first, followed by vector layers and, finally, note layers.
The catalogue file format is as follows. All fields are tab-separated. The above example uses spaces to ease formatting within this manual, but tabs must be used in the file. Each line describes one file and has 14 fields. Any empty field must contain a - character as in the fifth field of the examples. The fields are:
- Map name the name of the map (or map set) containing the layer
- Layer name the name of the individual layer
- Layer type V for vector, R for raster, N for note
- SRS name the name of the Spatial Referencing System, see Geodetic data.
- Zone the zone number when using UTM coordinates
- Min east the Easting of the South-West corner of the layer (in cm)
- Min north the Northing of the South-West corner of the layer (in cm)
- Max east the Easting of the North-East corner of the layer (in cm)
- Max north the Northing of the North-East corner of the layer (in cm)
- Colour/Width
- Vector layers: the colour encoded as red x 65536 + green x 256 + blue where red, green and blue are values between 0 and 255.
- Raster layers: the width (east-west) in pixels of the image.
- Note layers: always zero.
- Height
- Vector layers: always zero.
- Raster layers: the height (north-south) in pixels of the image.
- Note layers: always zero.
- East offset east-west fudge factor, normally zero.
- North offset north-south fudge factor, normally zero.
- Brief description a short text description.
Creating new note groups
To create a new note group within a project, add a line with the project
name and new group name (separated by a tab) to the note catalogue file:
<installdir>\MobiComp\FieldNote\mcfeNoteStore.note under Windows or
<installdir>/MobiComp/FieldMap/mcfeNoteStore.note under Linux,
Editing and creating note files
FieldNotes may be edited or created using a normal text editor. Existing note groups can be exported in XML format. They can then be edited and re-imported, see, Notes Preferences. New XML files can also be created and imported in the same way.
TO DO description of XML format, xmlschema? In the meantime, see what you can work out from an existing XML file...
Geodetic data files
TO DO full description, in the meantime, if you know what this is about, you'll probably be able to work it out.
The parameter files are found in <installdir>\MobiComp\Geo under Windows or <installdir>/MobiComp/Go under Linux.
ellipsoid.txt Ellipsiod parameters.
#name	           code semi-major axis  inverse flattening
Airy 1830          7001 6377563.396      299.3249646
Airy Modified 1849 7002 6377340.189      299.3249646
International 1924 7022 6378388          297
WGS 84             7030 6378137          298.257223563
datum.txt Geodetic Datum parameters
#name     code description           ellipsoid prime meridian	dx   dy  dz  geoid separation
ED50      6230 European Datum 1950        7022 0               -87  -98 -121 85
OSGB      6277 OSGB 1936                  7001 0               375 -111  431 38
OSIRL     6299 TM65                       7002 0               506 -122  611  7
WGS 84    6326 World Geodetic System 1984 7030 0                 0    0    0  0
Rome 1940 6806 Monte Mario (Rome)         7022 0.217334217    -225  -65    9  1
srs.txt Spatial Reference System parameters
#Name       code type unit datum  lat0(r)    lon0(r)	nZones   zAmp(r)     e0       n0N       n0S    f0         description
ED50        4230  G    d   6230
OSGB 1936   4277  G    d   6277
TM65        4299  G    d   6299
WGS 84      4326  G    d   6326
Monte Mario 4806  G    d   6806
UTM/ED50   230xx TM    m   6230  0            0.052359878  60	0.104719756  500000       0 10000000  0.9996       Universal Transverse Mercator, ED50 (zones 28N-38N)
UTM/WGS84  326xx TM    m   6326  0            0.052359878  60	0.104719756  500000       0 10000000  0.9996       Universal Transverse Mercator, WGS84
BNG        27700 TM    m   6277  0.855211357 -0.034906586   1	0            400000 -100000        0  0.9996012717 UK national projection
Irish NG   29900 TM    m   6299  0.93375115  -0.139626340   1	0            200000 -250000        0  1.000035     Irish national projection
Italy(W)   26591 TM    m   6806  0            0.157079633   1	0           1500000       0        0  0.9996       Italian national projection, West zone
Italy(E)   26592 TM    m   6806  0            0.261799388   1	0           2520000       0        0  0.9996       Italian national projection, East zone
Startup and configuration files
TO DO
Windows PC
PocketPC
- The startup script, FieldMap.lnk is distributed in
\MobiComp\bin, but installed in \Windows\Start Menu
or \Windows\Start Menu\Programs. Options are as for
Windows PCs, plus:
- The EVMConsole window is useful for tracing errors, but is not essential to the running of FieldMap. To remove it, add -Xnowinceconsole after evm.exe.
Linux (PC)
Linux (Zaurus)
Known Problems
The following are known issues which are being pursued. Please notify the author (N.S.Ryan@kent.ac.uk) of any other problems..
- The program will sometimes freeze when starting to redraw the map. This problem arises more often on PDAs. The only way out is to kill the program. On a PocketPC running Jeode, switch the the EVM console display and press the window close button.
- Survey Grid notes have stopped working in this version. This is a priority item to be fixed in the next minor release.
- Note templates have not yet been enabled. This is a priority item to be fixed in the next minor release.
Future enhancements
The following features should be addressed in the near future.
- Tiled maps: at present, every tile is listed in the map list. This will be changed so that tiled layers are treated as a single named map, with the program choosing automatically which tiles to load.
- Track recording on map: disable recording when fix quality is poor.
- GPS view: active tap areas to enable switching between views, as on Map view. Possibly also start/stop GPS functions.
- User interface: a third style using popup menus and active tap zones will provide slightly more space for the map view.
- MapLoader program
- Automate layer creation, map preferences New button.